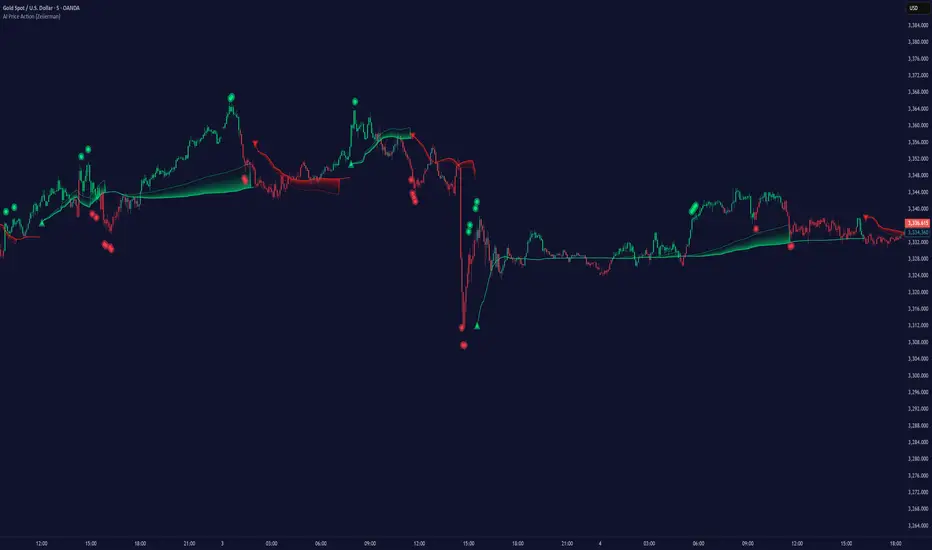
Higher Timeframe Price Action ScannerThis is a higher timeframe scanner that detects the price action trend on multiple timeframes and displays them all as red or green dots. You’ll be able to see the real time and historical price action trends so you can trade in the same direction of the overall trend on higher timeframes. You can also set it to scan a different ticker if you choose. If you find pairs that correlate very well, you can use two scanners and look at both of them for extra trend confluence.
CALCULATIONS
This scanner uses the same price action formula from our other indicator titled 1 Minute Scalping Indicator which can be found on our profile. It has Scalp Mode and Swing Mode. Both modes use the exact same price action parameters for signals, but Swing Mode will only give signals when the price action parameters are met AND the close is higher than the previous high for bull signals or when the close is lower than the previous low for bear signals.
HOW TO USE
The top line of the scanner shows the price action trend for the current chart timeframe and the rest are using the higher timeframe that you set in the input settings. They start with higher timeframe #1 as the second line from the top and go down from there.
When most or all of the dots are green, you should be looking for long positions and when most or all of the dots are red, you should be looking for short positions.
Since this scanner is using pure price action to identify trends, it’s a reliable way to see what multiple timeframes are doing.
PAIRINGS
Use this with the 1 Minute Scalping Indicator so you can get the signals and candles colored per the price action on your chart as well as see the higher timeframe price action trend from the scanner. Using both together will help you make better trading decisions.
MARKETS
You can use this scanner on any market.
TIMEFRAMES
This scanner will scan the current chart timeframe and display the result on the top line, then the lines below that will display the results from the higher timeframes you choose in the settings. It has timeframes from 1 minute all the way up to 1 year.
Search in scripts for "price action"

DMT 369 DRAGRONFLY StudyDragonfly Study version plus statistics panel
Successful traders trade with a fixed plan and without emotion, but this a lot harder than many new traders think. Many never master this skill and suffer continual drawdowns on their accounts as they overtrade high leverage positions in volatile markets.
ĐΜŦ Autobot resolves this issue by taking the human element out of the equation, allowing full automation of trades using TradingView alerts to trigger your favourite trading bot, such as Alertatron or 3Commas.
Being a Trend Reversal Indicator based on Volatility & Average True Range , ĐΜŦ Autobot is designed to identify spots in the market that offer suitable scalp and swing trade opportunities.
Due to popular demand we have expanded our ĐΜŦ Autobot product line to include the new ĐΜŦ Autobot Dragonfly 3-6-9 Edition which combines DMT with 3-6-9 Vortex mathematics, our Titan indicator and a multi-ladder scalping strategy to ensure you maintain a preferable average entry when price action moves against your position.
Indicator View
It its default state the DMT Autobot Dragonfly indicator displays key signal information, such as:
• Support & resistance range lines
• Titan Body Small & Large Time Frame lines
• Long & Short entry positions
• Long & Short position ladders
• Profit targets
Dragonfly displays a range between resistance (upper line) and support (lower line) on the chart.
Once the price is granted support in the range the lower line will turn green. As price action develops it will make repeated attempts to test support. If support holds price will attempt to test the resistance line (red).
When resistance is broken and the price is above the upper line, the line will turn blue confirming the bullish momentum and provide a potential buy opportunity.
Price action will make attempts to test the upper line as support and will keep rising while support is granted.
Once support is lost the upper line will become red once more. As price action develops it will make repeated attempts to test resistance. If resistance holds, the price will attempt to test the support line (green).
When support is broken and the price goes below the lower line, the line will turn red confirming the bearish momentum and provide a potential selling opportunity.
Price action will make attempts to test the lower line as resistance and will keep dropping while resistance is granted.
Titan Body
The Titan Body Small & Large time frame options in the indicator add additional trendlines to the chart to provide further clarity and confirmation to the Support & Resistance range indication.
Once price is granted support by the Small Time Frame trend line the line will turn green. As price action develops it will make repeated attempts to test the Small Time Frame support. Once the price is below the Small Time Frame trend line , the line will turn red and can act as resistance in a trend reversal.
When price is granted support by the Large Time Frame trend line the line will turn cyan. As price action develops it will make repeated attempts to test the Large Time Frame support. Once the price is below the Large Time Frame trend line , the line will turn orange and can act as resistance in a trend reversal.
The Titan Body enabled and customized in the indicator’s style settings,
Alert indicators
DMT Autobot Dragonfly Edition generates signals that can be used to scalp trade a volatile asset.
Signals are enabled and customized in the indicator’s input settings Additional options can be found in the options, but it is recommended that these are left at the default, as shown below. The indicator generates many
Entry and Profit levels can be disabled or customized in the indicator’s style settings,
Tradingview Alerts
Using Tradingview alerts, DMT Autobot Dragonfly signals can be used to trigger a trading bot.
To trigger a long or short position, set the Tradingview Alert Condition to DMT 369 Dragonfly and select the long or short option.
It is recommended that long or short positions are configured to trigger Once Per Bar Close
Ladders can also be triggered using alerts. To trigger a ladder order, set the Tradingview Alert Condition to DMT 369 Dragonfly and select the appropriate Long or Short ADD option that is to be triggered by the relevant values defined in the indicator’s configuration.
It is recommended that ladder orders are configured to trigger Once Per Bar,
To trigger a take profit order, set the Tradingview Alert Condition to DMT 369 Dragonfly and select the Long or Short TP option that is to be triggered by the relevant values defined in the indicator’s configuration.
Take profit orders can be configured as Once Per Bar Close or Once Per Minute.
If you wish to trigger a take profit signal immediately when the indicator’s defined take profit value is achieved, then use the Once Per Bar option.
Selecting Once Per Bar Close to generate a take profit signal is a gamble as the candle may close far away from the defined profit target – positive or negative.
While stops can be used, they are not applicable to the recommended ladder strategy.
Ladder Strategy
The DMT Autobot Dragonfly indicator always turns an underwater position into a win by utilizing a ladder strategy.
By using the recommended defaults, the indicator will trigger ladder orders at 3%, 6% & 9% using increasing order sizes,
Order sizes increase exponentially to ensure a good average price is maintained. If you are not using DMT Autobot Dragonfly signals to trigger ladder or take profit orders, please ensure your trading bot is configured to recalculate the new ladder entry and profit target based on the new average position entry price as each ladder is filled.
If you are using DMT Autobot Dragonfly on a leveraged asset, please ensure the leverage position is configured suitably so that your position is not liquidated if the price rapidly moves against you.
If u are looking for more information or access to the script please private msg me in trading view chat thx for support

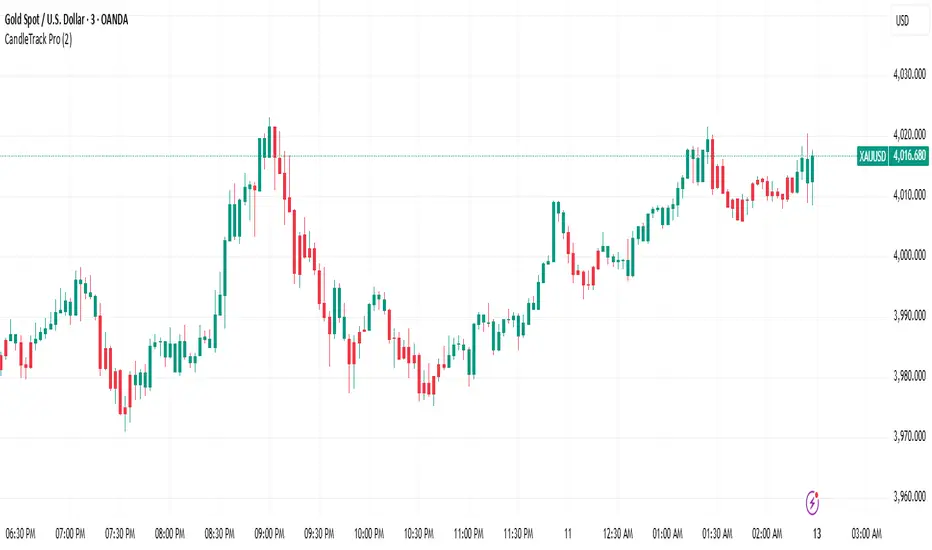
CandleTrack Pro | Pure Price Action Trend Detection📖 CandleTrack Pro | Pure Price Action Trend Detection
CandleTrack Pro is a clean, non-repainting trend detection tool built purely on price action logic.
It uses a dynamic ATR-based trailing system to detect trend shifts while keeping the chart visually simple.
🧠 How It Works
Tracks volatility using ATR.
Identifies trend shifts when price crosses trailing stops.
Highlights bullish and bearish bars visually for easy reading.
⚙️ Inputs
ATR Sensitivity: Controls how fast the trend adapts.
Use High/Low for Stop: Enables candle wick–based structure tracking.
📊 Ideal For
Traders who want a minimalist price action view with clear trend direction — no clutter, no lagging oscillators.
⚠️ Disclaimer
This script is for educational and technical analysis purposes only.
It is not financial advice. Always confirm setups using your own judgment and risk management.
GreenPen V.2 – Advanced Price Action Trading ToolGreenPen V.2 – Advanced Price Action Trading Tool
GreenPen V.2 is a closed-source invite-only indicator built on a unique Price Action methodology.
It focuses on detecting specific market structures and candle formations (e.g., engulfing, rejection, and breakout setups) and then automatically calculating TP1 and TP2 levels based on the underlying swing point.
Key features:
Real-time detection of valid Price Action signals.
Automatic calculation of TP1 and TP2 levels from the reference swing point (“signal base”).
Clean visual presentation with toggleable chart elements (open price lines, labels, alerts).
Optimized for the 4H timeframe, but flexible for other timeframes.
This tool is intended to help traders analyze market structure more clearly. It does not guarantee profitable results and should be used with proper risk management.
ภาษาไทย (optional, after English):
GreenPen V.2 – เครื่องมือ Price Action ขั้นสูง
GreenPen V.2 เป็นอินดิเคเตอร์แบบปิดโค้ด (invite-only) ที่ออกแบบตามแนวคิด Price Action เฉพาะทาง โดยมุ่งเน้นไปที่การตรวจจับโครงสร้างตลาดและแท่งเทียนสำคัญ (เช่น Engulfing, Rejection และ Breakout) พร้อมระบบคำนวณ TP1 และ TP2 อัตโนมัติจากจุด Swing หลัก
คุณสมบัติหลัก:
ตรวจจับสัญญาณ PA ได้แบบเรียลไทม์
คำนวณ TP1 / TP2 ให้อัตโนมัติจาก “จุดอ้างอิงสัญญาณ”
หน้าจอสะอาด เปิด/ปิดองค์ประกอบต่าง ๆ ได้ตามสไตล์
เหมาะกับ Timeframe 4 ชั่วโมง แต่ยืดหยุ่นใช้กับ TF อื่นได้
อินดิเคเตอร์นี้มีจุดประสงค์เพื่อช่วยให้เทรดเดอร์มองโครงสร้างตลาดได้ชัดเจนขึ้น ไม่ได้การันตีผลกำไร และควรใช้ควบคู่กับการจัดการความเสี่ยงที่เหมาะสม

Recent Range DetectorOverview
The Recent Range Detector is a specialized indicator designed to identify when an asset is currently range-bound, providing traders with clear support and resistance levels for range trading strategies. Unlike traditional indicators that focus on trend detection, this tool specifically answers the question: "Is the price range-bound right now, and what are the exact trading levels?"
Key Features
✅ Smart Range Detection - Uses a multi-factor scoring system to identify legitimate ranges
✅ Dynamic Support/Resistance Levels - Automatically calculates and displays key trading levels
✅ Range Quality Scoring - Provides confidence levels (Strong/Moderate/Weak Range)
✅ Touch Validation - Counts actual price touches to confirm range reliability
✅ Breakout Detection - Alerts when price exits the established range
✅ Visual Clarity - Clean boxes, lines, and labels for easy interpretation
How It Works
The indicator analyses recent price action using three core metrics:
Touch Quality (40%) - How many times price has respected support/resistance levels
Containment Quality (40%) - What percentage of recent bars stayed within the range
Recent Respect (20%) - Whether the latest price action confirms the range
These combine into a Range Score (0-1) that determines range strength and reliability.
Settings & Parameters
Range Lookback Period (Default: 15)
Number of bars to analyse for range detection
Shorter periods = more responsive to recent ranges
Longer periods = more stable, fewer false signals
Range Tolerance (Default: 2.0%)
Tolerance for price touches around exact highs/lows
Lower values = stricter range requirements
Higher values = more flexible range detection
Minimum Touches (Default: 3)
Required number of support/resistance touches for valid range
Higher values = more confirmed ranges, fewer signals
Lower values = more sensitive, earlier detection
Visual Options
Show Range Box: Displays the range boundaries
Show Support/Resistance Lines: Extends levels into the future
Understanding the Output
Range Score (0.000 - 1.000)
0.7+ = Strong Range (Green) - High confidence range trading setup
0.5-0.7 = Moderate Range (Yellow) - Decent range with some caution
0.3-0.5 = Weak Range (Orange) - Low confidence, be careful
<0.3 = Not Ranging - Avoid range trading strategies
Range Status Classifications
Strong Range - Perfect for range trading strategies
Moderate Range - Good range with normal risk
Weak Range - Marginal range, use smaller positions
Not Ranging - Price is trending or too choppy for range trading
Key Metrics in Info Table
Range Size (%) - Size of the range relative to price level
5-15% = Ideal range size for most strategies
<5% = Tight range, lower profit potential
>15% = Wide range, higher profit potential but more risk
Support/Resistance Levels - Exact price levels for entries/exits
Use these as your key trading levels
Support = potential buy zone
Resistance = potential sell zone
Total Touches - Number of times price respected the levels
3-5 touches = Newly formed range
6-10 touches = Well-established range
10+ touches = Very strong, reliable range
Price Position (%) - Current location within the range
0-20% = Near support (potential long opportunity)
80-100% = Near resistance (potential short opportunity)
40-60% = Middle of range (wait for better entry)
Visual Elements
Range Box
Green Box = Strong Range (Score ≥ 0.7)
Yellow Box = Moderate Range (Score 0.5-0.7)
Orange Box = Weak Range (Score 0.3-0.5)
Support/Resistance Lines
- Horizontal lines showing exact trading levels
- Extend into the future for forward guidance
- Colour matches the range strength
Background Colouring
- Subtle background tint during range periods
- Helps quickly identify ranging vs trending markets
Breakout Signals
- 📈 RANGE BREAK UP - Price breaks above resistance
- 📉 RANGE BREAK DOWN - Price breaks below support
- Only appears for confirmed ranges (Score ≥ 0.5)
Trading Applications
Range Trading Strategy
1. Look for Range Score ≥ 0.5
2. Buy near support (Price Position 0-20%)
3. Sell near resistance (Price Position 80-100%)
4. Set stops just outside the range
5. Exit on breakout signals
Breakout Strategy
1. Identify strong ranges (Score ≥ 0.7)
2. Wait for volume-confirmed breakout
3. Enter in breakout direction
4. Use previous resistance as support (or vice versa)
Market Context
- Strong ranges often occur after trending moves
- Use higher timeframes to confirm overall market structure
- Combine with volume analysis for better entries/exits
Best Practices
What to Look For
✅ Range Score ≥ 0.5 for trading consideration
✅ Multiple touches (5+) for confirmation
✅ Clear price rejection at levels
✅ Reasonable range size (5-15% for most assets)
✅ Recent price respect of boundaries
What to Avoid
❌ Trading ranges with Score < 0.3
❌ Very tight ranges (<3% size) - low profit potential
❌ Ranges with only 1-2 touches - not confirmed
❌ Ignoring breakout signals
❌ Trading against the higher timeframe trend
Alerts Available
- Range Detected - New range formation
- Range Break Up - Upward breakout
- Range Break Down - Downward breakout
- Range Ended - Range condition ended
Timeframe Recommendations
- Daily Charts - Best for swing trading ranges
- 4H Charts - Good for intermediate-term ranges
- 1H Charts - Suitable for day trading ranges
- Lower Timeframes - May produce more noise
Conclusion
The Recent Range Detector eliminates guesswork in range identification by providing objective, quantified range analysis. It's particularly valuable for traders who prefer range-bound strategies or need to identify when trending strategies should be avoided.
Remember: No indicator is perfect. Always combine with proper risk management, volume analysis, and broader market context for best results.
Disclaimer
This indicator is for educational purposes only and should not be considered as financial advice. Trading involves risk, and past performance does not guarantee future results. Always conduct your own research and consider your risk tolerance before making any trading decisions.

Multi-Timeframe Price Action AnalysisMulti-Timeframe Price Action Analysis
This indicator analyzes price action across multiple timeframes to determine bullish and bearish signals. It creates a dashboard showing how price interacts with previous candles' highs and lows.
Features
- Analyzes 4 customizable timeframes simultaneously
- Detects when price:
-- Grabs lows and comes back inside (bullish)
-- Grabs highs and comes back inside (bearish)
-- Grabs both highs and lows
-- Moves above previous high
-- Moves below previous low
-- Calculates bullish/bearish percentages for each timeframe
-- Visual dashboard with color-coded signals
Adjustable confirmation settings
-- Settings
-- Customize timeframes (default: 15min, 1H, 4H, D)
-- Toggle confirmation waiting
-- Set number of confirmation candles
This is a very rudimentary version.. I will make a more robust version soon
For it to be considered a "grab" the current price must be within the previous candle's range..
This also does not focus on candle closures just highs and lows
Also note that this is a little aggressive in that it does not require a bullish close for example to be considered bullish, a bearish close inside the previous candle is considered valid, this is to handle the morning stars that have a slightly bearish close in middle candle etc.. obviously do not rely on this indicator.. look at the price action and determine if you think its worth taking..
Same goes for bullish closes inside previous candle after grabbing highs..

Auto Price Action SR Levels by Chaitu50cAuto Price Action SR Levels by Chaitu50c:
This is a session-based support and resistance indicator that identifies price levels based on actual candle activity, without relying on traditional indicators. It works by clustering open, high, low, or close values of past candles that frequently occur within a defined price range, making it a reliable price action-based tool for intraday traders.
The indicator calculates these levels at the start of each new trading session (based on NSE 09:15 time) and keeps them static throughout the session. This avoids unnecessary noise or flickering due to live price action, giving traders consistent zones to work with during the day.
FEATURES:
* Automatic detection of support and resistance levels based on candle price hits
* Cluster formation using high/low or open/close logic
* Static levels: calculated once per session and remain unchanged until the next session
* Adjustable settings for:
* Cluster range (in points)
* Number of lookback candles
* Line width
* Line color (default: black)
* Minimalist design for a clean chart experience
HOW IT WORKS:
The indicator looks back over a defined number of candles at the beginning of each session. It clusters prices that fall within a specified range (e.g., 250 points) and counts how many times they appear as open, high, low, or close values. If a price level is hit at least once (default), it is considered significant and a line is plotted.
Because clustering is done once per session, the lines do not shift during the session. This allows traders to base decisions on fixed, stable levels formed by prior market structure.
RECOMMENDED FOR:
* Intraday traders
* Price action traders
* Traders who prefer clean charts with logical SR zones
* Nifty, BankNifty, and stock-based day trading
Created by Chaitu50c for traders who rely on logic and structure, not signals.
Disclaimer:
This indicator is intended for educational and informational purposes only. It does not constitute financial advice or trading recommendations. Use at your own discretion and always manage risk responsibly.
---
Let me know if you’d like to include use-case examples or screenshots before publishing.

Time-Weighted Price Action IndicatorThe Time-Weighted Price Action Indicator is a simple yet effective tool designed to detect consolidation zones based on time duration and highlight potential reversal points using a contrarian breakout logic. Instead of following traditional breakout strategies, this indicator aims to capitalize on false breakouts and reversal entries.
How It Works
• The indicator identifies a price range (zone) using a configurable lookback period.
• If the price remains within this range for a specified number of bars (threshold), a consolidation zone is confirmed.
• Once a breakout or breakdown from this zone occurs, the indicator triggers a reversed signal — suggesting a potential reversal instead of a trend-following entry.
• Support and resistance levels are marked visually, and BUY/SELL labels are plotted when price re-enters the zone, indicating potential exhaustion or traps.
Key Features
• ✅ Time-based consolidation detection
• ✅ Contrarian signal logic (Buy at breakdowns, Sell at breakouts)
• ✅ Dynamic zone plotting with support/resistance visualization
• ✅ Auto-reset after each breakout for fresh zone detection
• ✅ Visual labels and alerts for BUY/SELL signals
How to Use
• Ideal for range-bound markets or identifying trap zones around support/resistance.
• Use in conjunction with volume, momentum, or trend filters to refine entries.
• Can complement mean reversion strategies or be used as a signal confirmation tool.
Why This Combination?
This approach blends time-based consolidation logic with a contrarian price action perspective, offering traders a different lens to analyze markets. Instead of blindly following breakouts, it highlights areas where price rejections and false breakouts often occur — common in algorithm-driven markets.
Why It’s Worth Using
This indicator helps you stay ahead of trap zones, identify reversal spots, and understand price behavior in consolidation zones — a critical edge, especially in sideways or choppy markets. It adds context to price movement, helping traders avoid common breakout failures.
Note:
• No performance guarantees or exaggerated claims.
• No solicitation or promotional language used.
• This is a free, open-source educational tool meant to aid price action understanding.

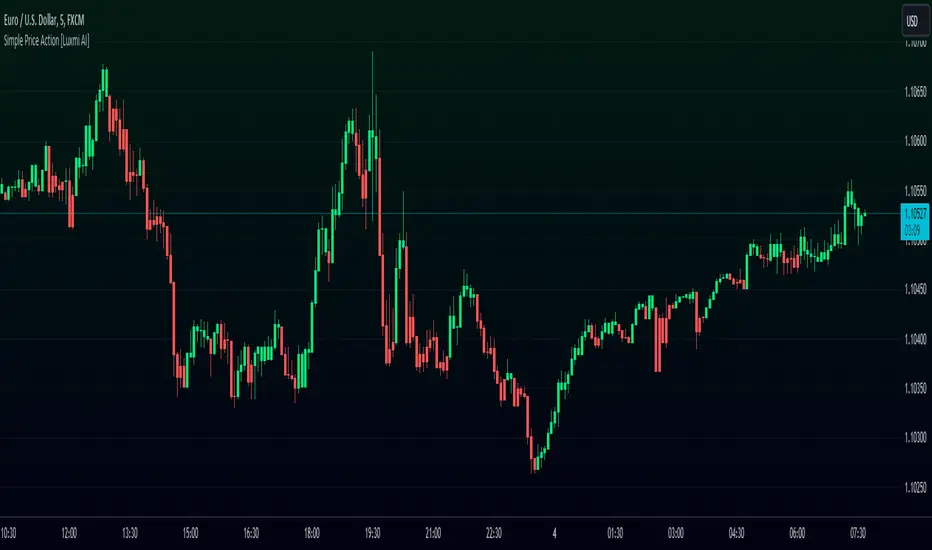
Simple Price Action [Luxmi AI]Introducing the Simple Price Action Indicator
The Simple Price Action Indicator is designed to help traders quickly identify market trends and make informed decisions. This custom-built Pine Script tool changes candle colors on your chart based on price movement:
- Lime Green Candles indicate bullish momentum when the current price closes above the previous candle’s high.
- Red Candles signal bearish momentum when the price closes below the previous candle’s low.
Alongside these visual cues, the indicator generates Buy and Sell signals based on color changes:
- A buy signal appears when a red candle turns green.
- A sell signal shows up when a green candle turns red.
These signals are displayed directly on the chart as small labels ("B" for buy and "S" for sell), helping you easily spot trading opportunities. You can also set up alerts to notify you whenever a new signal is triggered, ensuring you never miss a trade.
The Simple Price Action Indicator is a straightforward yet effective tool for traders looking to enhance their price action analysis.
How It Works: Under the Hood
The script begins by defining two key colors—lime green for bullish candles and red for bearish candles. It then determines the candle color based on the closing price relative to the previous candle's high and low. If a bullish or bearish condition is met, the candle is colored accordingly.
Next, the script checks for a change in candle color to generate buy and sell signals. If a candle turns green after being red, a buy signal is plotted below the candle. If a candle turns red after being green, a sell signal is plotted above the candle.
Finally, the script includes alert conditions that correspond to these buy and sell signals, ensuring you can react quickly to potential trades.
Mxwll Price Action Suite [Mxwll]Introducing the Mxwll Price Action Suite!
The Mxwll Price Action Suite is an all-in-one analysis indicator incorporating elements of SMC and also ideas extending beyond the trading methodology!
Features
Internal structures
External structures
Customizable Sensitivities
BoS/CHoCH
Order Blocks
HH/LH/LL/LH Areas
Rolling TF highs/lows
Rolling Volume Comparisons
Auto Fibs
And more!
The image above shows the indicator's market structure identification capabilities. Internal BoS and CHoCH structures in addition to overarching market structures are available with customizable sensitivities.
The image above shows the indicator identifying order blocks! Additionally, HH/LH/LL/LH areas are also identified.
The image above shows a rolling area of interest. These areas can be compared to supply/demand zones, where traders might consider a bargain long/short/sell area.
The indicator displays a rolling 4hr high/low and 1D high/low, alongside auto fibonacci levels with a customizable sensitivity.
Finally, the Mxwll Price Action Suite shows relevant session information.
Table information
Current Session
Countdown to session close
Next Session
Countdown to next session open
Rolling 4-Hr volume intensity
Rolling 24-Hr volume intensity
Introducing the Mxwll SMC Suite!
The Mxwll SMC Suite is an all-in-one analysis indicator incorporating elements of SMC and also ideas extending beyond the trading methodology!
Features
Internal structures
External structures
Customizable Sensitivities
BoS/CHoCH
Order Blocks
HH/LH/LL/LH Areas
Rolling TF highs/lows
Rolling Volume Comparisons
Auto Fibs
And more!
The image above shows the indicator's market structure identification capabilities. Internal BoS and CHoCH structures in addition to overarching market structures are available with customizable sensitivities.
The image above shows the indicator identifying order blocks! Additionally, HH/LH/LL/LH areas are also identified.
The image above shows a rolling area of interest. These areas can be compared to supply/demand zones, where traders might consider a bargain long/short/sell area.
The indicator displays a rolling 4hr high/low and 1D high/low, alongside auto fibonacci levels with a customizable sensitivity.
Finally, the Mxwll Price Action Suite shows relevant session information.
Table information
Current Session
Countdown to session close
Next Session
Countdown to next session open
Rolling 4-Hr volume intensity
Rolling 24-Hr volume intensity
Expanded Features of Mxwll Price Action Suite
Internal and External Structures
Internal Structures: These elements refer to the price formations and patterns that occur within a smaller scope or a specific trading session. The suite can detect intricate details like minor support/resistance levels or short-term trend reversals.
External Structures: These involve larger, more significant market patterns and trends spanning multiple sessions or time frames. This capability helps traders understand overarching market directions.
Customizable Sensitivities
Adjusting sensitivity settings allows users to tailor the indicator's responsiveness to market changes. Higher sensitivity can catch smaller fluctuations, while lower sensitivity might focus on more significant, reliable market moves.
Break of Structure (BoS) and Change of Character (CHoCH)
BoS: This feature identifies points where the price breaks a significant structure, potentially indicating a new trend or a trend reversal.
CHoCH: Detects subtle shifts in the market's behavior, which could suggest the early stages of a trend change before they become apparent to the broader market.
Order Blocks and Market Phases
Order Blocks: These are essentially price levels or zones where significant trading activities previously occurred, likely pointing to the positions of smart money.
HH/LH/LL/LH Areas: Identifying Higher Highs (HH), Lower Highs (LH), Lower Lows (LL), and Lower Highs (LH) helps in understanding the trend and market structure, aiding in predictive analysis.
Rolling Timeframe Highs/Lows and Volume Comparisons
Tracks highs and lows over specified rolling periods, providing dynamic support and resistance levels.
Compares volume data across different timeframes to assess the strength or weakness of the current price movements.
Auto Fibonacci Levels
Automatically calculates and plots Fibonacci retracement levels, a popular tool among traders to identify potential reversal points based on past movements.
Session Data and Volume Intensity
Session Information: Displays current and upcoming trading sessions along with countdown timers, which is crucial for day traders and those trading on session overlaps.
Volume Intensity: Measures and compares the volume within the last 4 hours and 24 hours to gauge market activity and potential breakout/breakdown movements.
Visualizations and Practical Use
Dynamic Visuals: The suite provides dynamic visual aids, such as real-time updating of high/low markers and Fibonacci levels, which adjust as new data comes in. This feature is critical in fast-paced markets.
Strategic Entry/Exit Points: By identifying order blocks and using Fibonacci levels, traders can pinpoint strategic entry and exit points, maximizing potential returns.
Risk Management: Enhanced features like session countdowns and volume intensity help in better risk management by providing traders with more data on market sentiment and potential volatility.

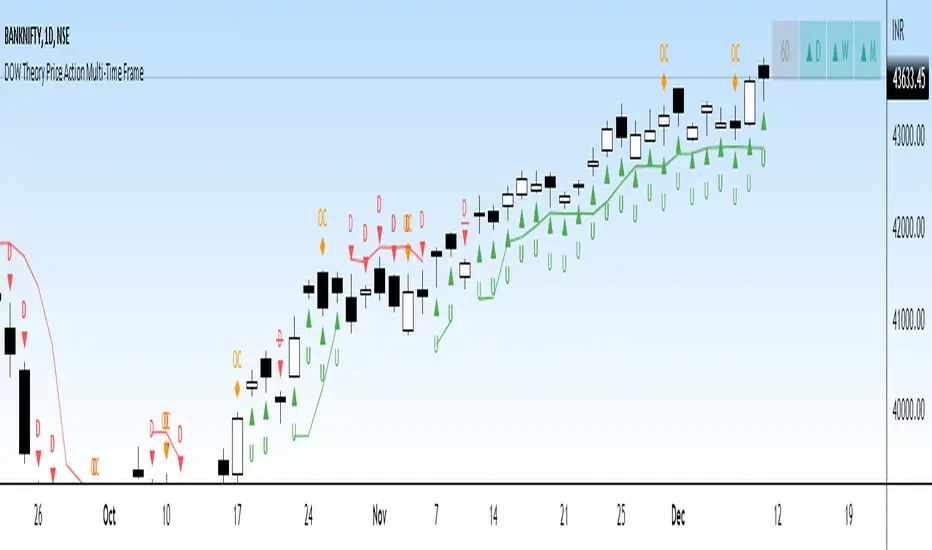
DOW Theory Price Action Multi-Time FrameThis indicator gives a visual representation of Dow Theory Price action based trend analysis and provides trader a table with 4 different timeframe to align with the trend.
It will help traders identify if it is an ongoing Impulse Wave or a Corrective Wave.
3 rules for Bullish Price Action setup (Uptrend or continuation of existing UpTrend): Denoted by 'U' below the candlestic
HH - Higher High
HL - Higher Low
CAH - Close above prior High
3 rules for Bearish Price Action setup (Downtrend or continuation of existing DownTrend): Denoted by 'D' below the candlestic
LH - Lower High
HL - LowerLow
CAH - Close below prior Low
Exception - Outside Candle: Denoted by 'OC' above the candlestic
Outside reversal is a two-day price pattern that shows when a candle or bar on a candlestick or bar chart falls “outside” of the previous day's candle or bar.
The table posistion can be set be user from the input settings as per his screen setting / resolution.
The trailing line can is also customizable from inputs, recomended value is 3-4.
Ideation Credits: Mr. Vineet Jain
Multi Price Action & Candlestick Patterns - Horizontals R/SNote:
This is a script that synthesizes a number of popular price action and candlestick patterns along with a trading strategy based on horizontal support and resistance. Scripts are used for learning and research purposes.
Useage:
Support and resistance are two important areas in Price Action analysis and trading. After confirming the support and resistance zone line, waiting to confirm the appropriate candlestick pattern and execute the trade, set a reasonable stop loss and take profit, This is critical for compliance with your money management rules.
Notation:
In the script, price action and candlestick pattern are denoted as follows:
- Bullish Engulfing (BU) & Bearish Engulfing (BE)
- Hammer (HM)
- Hanging Man (MM)
- Morning Star (MS)
- Evening Star (ES)
- Tweezer Top (TZT)
- Tweezer Bottom (TZB)
- Shooting Star (SS)
- Bullish Pinbar (PBBBU) & Bearish Pinbar (PBBE)
- Doji Gravestone (GS)
- Doji Dragonfly (DF)
- Doji - Long legged (LL)
- Spinning Top (ST)
Settings:
- Number of left candle to compare lowest/highest: Compare the high/low price of the current candle with the highest/lowest price of previous candles.
- Number of left candle to calc avg body: Compare the average price of the current candle with the average price of previous candles
- S/R Left Bars: The number of bars left hand side of the Pivot
- S/R Right Bars: The number of bars right hand side of the Pivot
- S/R Volume Threshold - The threshold value (%) for the volume oscillator
The code is open and commented - please feel free to use, share, comment & provide feedback.
Good luck!
Feel free to get indicator or strategy trading signals at yummyprofit.

Ethereum: Price Action Integral BandsThis indicator tries to display absolute tops and bottoms for Ethereum. The price action gets integrated with three custom functions resulting in the blue top, green mid and red bottom price action integrals. From those integral values we allow 5% deviation in up and down direction, leading to price action integral bands of some non-zero width.
Even during the liquidity crisis in March 2020 with abnormal price movements, Ethereum had no daily or weekly candle close below the support band. For longer-term trades it might be a good idea to buy ETH when price is around the red band, and temporarily sell/go short when ETH is around the blue band, although this is no financial advice and one should always cross-check with other indicators/informations.
The green mid price action integral band indicates bullish/bearish zones. When price is located above the green band, the market is in a bullish environment, if price lies below it, the market is in a bearish environment.
There's the option to plot or hide the bands individually.
These integral bands are specifically designed for the Ethereum (ETHUSD) Kraken ticker on daily (D) or weekly (W) timeframe (the indicator automatically adjusts for both those timeframes). For other assets, tickers and timeframes the functionality of this indicator cannot be guaranteed and will most probably not deliver meaningful results. If you want to use the integral bands for Bitcoin, please see my other indicator titled 'Bitcoin: Price Action Integral Bands'.
For access please contact me via DM on TradingView or on Twitter (linked in my TradingView profile and my signature).

Bitcoin: Price Action Integral BandsThis indicator tries to display absolute tops and bottoms for Bitcoin. The price action gets integrated with two custom functions resulting in the blue top and red bottom price action integrals. From those integral values we allow 5% deviation in up and down direction, leading to price action integral bands of some non-zero width.
Even in the current liquidity crisis with abnormal price movements, Bitcoin had no weekly candle close below the support band. One thing to note is that in the here presented model, up until now only one single weekly candle touches the blue band in each of Bitcoin's cycles. For longer-term trades it might be a good idea to buy BTC when price is around the red band, and sell/go short when BTC is around the blue band, although this is no financial advice and one should always cross-check with other indicators/informations.
There's the option to plot or hide the bands individually.
The integral bands are specifically designed for the Bitcoin BLX (BraveNewCoin Liquid Index) ticker on weekly timeframe. For other assets, tickers and timeframes the functionality of this indicator cannot be guaranteed and will most probably not deliver meaningful results.

Intelligent Price Action - Movement Up (Expo)Intelligent Price Action - Movement Up (Expo)
DESCRIPTION
Intelligent Price Action - Movement Up (Expo) identifies important up movements that have an impact on current price characteristics. The indicator is visualizing buying pressure! These price patterns are valuable insight when trading the market.
This indicator response faster to price movement and is more focused on detecting buying pressure rather than exhausted buyers.
• Buying pressure is seen in reversal points.
• Buying pressure can be seen when the buyers are exhausted.
• Buying pressure can be seen in positive breakouts.
HOW TO USE
1. Use the indicator to identify buying pressure.
2. Use the indicator to identify reversal points.
3. Use the indicator to identify exhausted buyers.
4. Use the indicator to identify breakouts.
Combine the indicator with ‘ Intelligent Price Action - Movement Down (Expo) ’ or with my other Price Action indicators.
INDICATOR IN ACTION
EURUSD
BTCUSD
BTCUSD
GOLD
WALL STREET
WALL STREET
BTCUSD
EURUSD
The indicator works with RENKO, HEIKIN ASHI and with KAGI charts as well.
I hope you find this indicator useful , and please comment or contact me if you like the script or have any questions/suggestions for future improvements. Thanks!
I will continue to work on this indicator, so please share your experience and feedback with me so that I can continuously improve it. Thanks to everyone that have contacted me regarding my scripts. Your feedback is valuable for future developments!
ACCESS THE INDICATOR
• Contact me on TradingView or use the links below
-----------------
Disclaimer
Copyright by Zeiierman.
The information contained in my scripts/indicators/ideas does not constitute financial advice or a solicitation to buy or sell any securities of any type. I will not accept liability for any loss or damage, including without limitation any loss of profit, which may arise directly or indirectly from use of or reliance on such information.
All investments involve risk, and the past performance of a security, industry, sector, market, financial product, trading strategy, or individual’s trading does not guarantee future results or returns. Investors are fully responsible for any investment decisions they make. Such decisions should be based solely on an evaluation of their financial circumstances, investment objectives, risk tolerance, and liquidity needs.
My scripts/indicators/ideas are only for educational purposes!
Intelligent Price Action - Movement Down (Expo)Intelligent Price Action - Movement Down (Expo)
DESCRIPTION
Intelligent Price Action - Movement Down (Expo) identifies important down movements that have an impact on current price characteristics. The indicator is visualizing selling pressure! These price patterns are valuable insight when trading the market.
This indicator response faster to price movement and is more focused on detecting selling pressure rather than exhausted sellers.
• Selling pressure is seen in reversal points.
• Selling pressure can be seen when the sellers are exhausted.
• Selling pressure can be seen in negative breakouts.
HOW TO USE
1. Use the indicator to identify selling pressure.
2. Use the indicator to identify reversal points.
3. Use the indicator to identify exhausted sellers.
4. Use the indicator to identify breakouts.
Combine the indicator with ‘ Intellilligent Price Action - Movement Up (Expo) ’ or with my other Price Action indicators.
INDICATOR IN ACTION
EURUSD
EURUSD
BTCUSD
BTCUSD
GOLD
WALL STREET
WALL STREET
EURUSD
BTCUSD
BRENT
The indicator works with RENKO, HEIKIN ASHI and with KAGI charts as well.
I hope you find this indicator useful , and please comment or contact me if you like the script or have any questions/suggestions for future improvements. Thanks!
I will continue to work on this indicator, so please share your experience and feedback with me so that I can continuously improve it. Thanks to everyone that have contacted me regarding my scripts. Your feedback is valuable for future developments!
ACCESS THE INDICATOR
• Contact me on TradingView or use the links below
-----------------
Disclaimer
Copyright by Zeiierman.
The information contained in my scripts/indicators/ideas does not constitute financial advice or a solicitation to buy or sell any securities of any type. I will not accept liability for any loss or damage, including without limitation any loss of profit, which may arise directly or indirectly from use of or reliance on such information.
All investments involve risk, and the past performance of a security, industry, sector, market, financial product, trading strategy, or individual’s trading does not guarantee future results or returns. Investors are fully responsible for any investment decisions they make. Such decisions should be based solely on an evaluation of their financial circumstances, investment objectives, risk tolerance, and liquidity needs.
My scripts/indicators/ideas are only for educational purposes!

Intelligent Price Action - Positive Close (Expo)Intelligent Price Action - Positive Close (Expo)
DESCRIPTION
Intelligent Price Action - Positive Close (Expo) identifies important positive closes that have an impact on current price characteristics. The indicator is visualizing buying pressure! These price patterns are valuable insight when trading the market.
• Buying pressure is seen in reversal points.
• Buying pressure can be seen when the buyers are exhausted.
• Buying pressure can be seen in positive breakouts.
HOW TO USE
1. Use the indicator to identify buying pressure.
2. Use the indicator to identify reversal points.
3. Use the indicator to identify exhausted buyers.
4. Use the indicator to identify breakouts.
Combine the indicator with ‘I ntellilligent Price Action - Negative Close (Expo) ’ or with my other Price Action indicators.
INDICATOR IN ACTION
EURUSD
EURUSD
BTCUSD
BRENT
WALL STREET
WALL STREET
WALL STREET
BTCUSD
BTCUSD
EURUSD
EURUSD
The indicator works with RENKO, HEIKIN ASHI and with KAGI charts as well.
I hope you find this indicator useful , and please comment or contact me if you like the script or have any questions/suggestions for future improvements. Thanks!
I will continue to work on this indicator, so please share your experience and feedback with me so that I can continuously improve it. Thanks to everyone that have contacted me regarding my scripts. Your feedback is valuable for future developments!
ACCESS THE INDICATOR
• Contact me on TradingView or use the links below
-----------------
Disclaimer
Copyright by Zeiierman.
The information contained in my scripts/indicators/ideas does not constitute financial advice or a solicitation to buy or sell any securities of any type. I will not accept liability for any loss or damage, including without limitation any loss of profit, which may arise directly or indirectly from use of or reliance on such information.
All investments involve risk, and the past performance of a security, industry, sector, market, financial product, trading strategy, or individual’s trading does not guarantee future results or returns. Investors are fully responsible for any investment decisions they make. Such decisions should be based solely on an evaluation of their financial circumstances, investment objectives, risk tolerance, and liquidity needs.
My scripts/indicators/ideas are only for educational purposes!

Galen Woods Price Action Timeframe IndexThis indicator determines if an intraday time-frame is amenable to price action analysis.
You can use it to find out the minimum time-frame that is suitable for price action analysis.
The time-frame is amenable to price action analysis if the index remains below 0.5. If the index rises above 0.5, the time-frame might not be suitable for price action analysis. In that case, consider increasing your time-frame.
It is normal to find that only certain periods in a day are suitable for price action analysis. Use these indications to focus your trading efforts.
Note : This indicator is for assessing intraday time-frames.
This indicator is available for purchase as part of Galen Woods' Day Trading With Price Action Course.

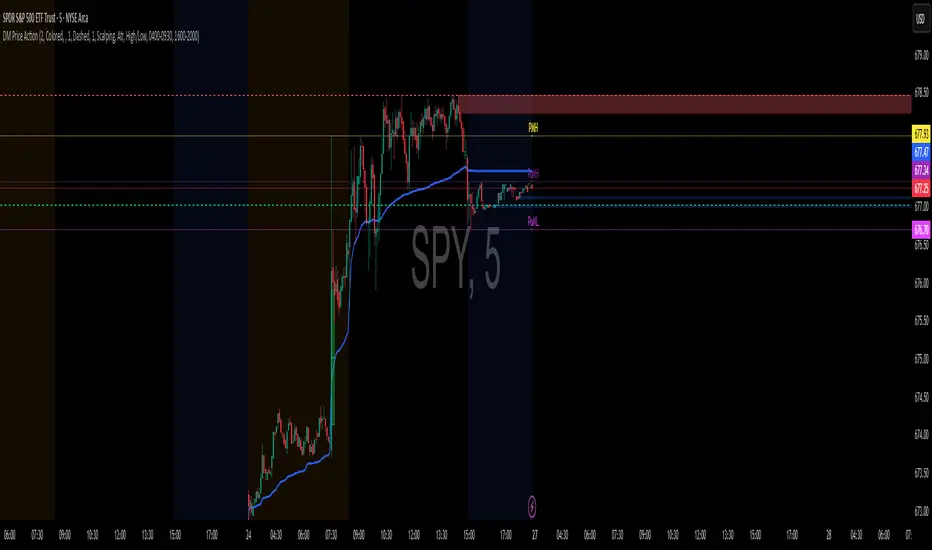
DM Price ActionHere’s a tight, rules-based playbook for trading with your DM Price Action (FVG + S/R + Order Blocks + VWAP + Auto PDH/PDL/PMH/PML). It’s educational, not financial advice—tune to your market & risk.
Core ideas (what each tool does for you)
VWAP → intraday trend/mean.
PDH/PDL → yesterday’s extremes; magnet & reversal/continuation levels.
PMH/PML → premarket extremes; first liquidity tests after the open.
FVG → imbalance zones for continuation entries.
Order Blocks (OBs) → origin of impulses; mitigation/breaks = structure shifts.
S/R → target rails and break alerts.
Setups (long/short mirror)
1) Bias + Pullback (FVG/OB) at Key Level
Bias (need 2+ conditions):
Price above VWAP (bulls) / below VWAP (bears)
Price above PDH/PMH (bulls) or below PDL/PML (bears)
Most recent Swing OB bias in your direction (script updates via crosses)
Entry (bullish example):
Wait for a Bullish FVG to form after we reclaim PMH or PDH.
Prefer FVG overlapping a Bullish OB or sitting just above Support.
Enter on retrace into FVG midline or first bullish reversal candle inside.
Stop: a few ticks below OB low (or FVG bottom, whichever is wider).
Targets:
T1: nearest Resistance or PDH/PMH if not yet tested.
T2: next HTF S/R or fixed 2R–3R.
Manage: to BE at 1R, trail under swing lows or VWAP on trend days.
Bearish mirror: below VWAP, below PDL/PML, Bearish FVG into Bearish OB / Resistance; stop above OB high.
2) Range Break & Retest at PDH/PDL (with OB confirmation)
Context: Price consolidates under PDH (or over PDL).
Trigger: Clean break of PDH/PDL with an OB breakout alert in the break direction.
Entry: On retest of PDH/PDL from the other side, look for a small FVG forming with the move → enter on the pullback.
Stop: beyond the retest wick or the OB edge.
Targets: next S/R, opposing day extreme (e.g., from PDH to PMH/HTF level) or 2R/3R.
3) Premarket Sweep Reversal (open-specific)
Setup: At/near the cash open, price sweeps PMH/PML (wick through) but closes back inside, then a counter-direction OB forms.
Entry: On first FVG in the reversal direction that overlaps that new OB.
Stop: beyond the sweep extreme (PMH/PML).
Targets: VWAP first, then PD midline levels/SR.
Confluence checklist (score ≥3 before clicking)
+1 Above/below VWAP in trade direction
+1 Trading from a PDH/PDL/PMH/PML reaction (reclaim or rejection)
+1 FVG overlaps an OB
+1 Entry at S/R (use the script’s lines)
+1 Fresh zone (recently formed OB/FVG)
+1 Higher-TF structure aligned (e.g., 1H trend)
Take the trade only if score ≥3; size up only at ≥4.
Execution framework (simple & repeatable)
Timeframes: 1H (bias) → 5–15m (execution).
Risk per trade: 0.25–1.0% of account (fixed).
Position size: Size = Risk $ / Stop distance.
Management:
Scale ½ at T1 (nearest SR/PD level), move stop to BE at 1R.
Let runner to T2 (2R–3R) or next PD level.
If VWAP flips against you and closes 2 bars opposite, exit remainder.
Using the inputs (what to tweak)
Order Blocks:
Scalping mode for intraday speed; Day Trade for cleaner swings.
Hide Internal OBs if noise is high; keep Swing OBs for structure.
FVG:
Keep Auto Threshold = ON.
If noisy, plot higher TF FVG (e.g., 15m FVG on 5m chart).
PDH/PDL/PMH/PML:
If chart is cluttered, keep “Show lines only on last bar” ON and labels ON.
Session markets (futures/US equities): use default 0400–0930 premarket; FX/crypto can disable PM lines if irrelevant.
Alerts to set (so you only act on confluence)
Create alerts for:
Bullish/Bearish FVG (execution zones)
Swing/Internal OB Breakout (structure shift)
Support/Resistance Broken (targets/continuation)
(Optional) Crossing PDH/PDL: use TV “Price crossing” with the plotted PDH/PDL values or visually monitor the labels
Workflow: Wait for ≥2 alerts to line up (e.g., Swing OB Breakout + Bullish FVG near PDH), then open the chart and execute the rule set.
Example trade (bullish)
Price reclaims PDH, holds above VWAP.
Bullish FVG prints overlapping a Bullish Internal OB just above PDH.
Limit at FVG midline, stop below OB low.
T1 = next Resistance; T2 = 2R. Move to BE at 1R; trail under new swing lows.
Price–Volume Anomaly DetectorDescription
This indicator identifies unusual relationships between price strength and trading volume. By analyzing expected intraday volume behavior and comparing it with current activity, it highlights potential exhaustion, absorption, or expansion events that may signal changing market dynamics.
How It Works
The script profiles average volume by time of day and compares current volume against this adaptive baseline. Combined with normalized price movement (ATR-based), it detects conditions where price and volume diverge:
Exhaustion: Strong price move on low volume (potential fade)
Absorption: Weak price move on high volume (potential reversal)
Expansion: Strong price move on high volume (momentum continuation)
Key Features
Adaptive time-based volume normalization
Configurable sensitivity thresholds
Optional visibility for each anomaly type
Adjustable label transparency and offset
Light Mode support: label text automatically adjusts for dark or light chart backgrounds
Lightweight overlay design
Inputs Overview
Volume Profile Resolution: Defines time bucket size for expected volume
[* ]Lookback Days: Controls how quickly the profile adapts
Price / Volume Thresholds: Tune anomaly sensitivity
Show Expansion / Exhaustion / Absorption: Toggle specific labels
Label Transparency & Offset: Adjust chart visibility
How to Use:
Apply the indicator to any chart or timeframe.
Observe where labels appear:
🔴 Exhaustion: strong price, weak volume
🔵 Absorption: weak price, strong volume
🟢 Expansion: strong price, strong volume
Use these as context clues, not trade signals — combine with broader volume or trend analysis.
How It Helps
Reveals hidden price–volume imbalances
Highlights areas where momentum may be fading or strengthening
Enhances understanding of market behavior beyond raw price action
⚠️Disclaimer:
This script is provided for educational and informational purposes only. It is not financial advice and should not be considered a recommendation to buy, sell, or hold any financial instrument. Trading involves significant risk of loss and is not suitable for every investor. Users should perform their own due diligence and consult with a licensed financial advisor before making any trading decisions. The author does not guarantee any profits or results from using this script, and assumes no liability for any losses incurred. Use this script at your own risk.

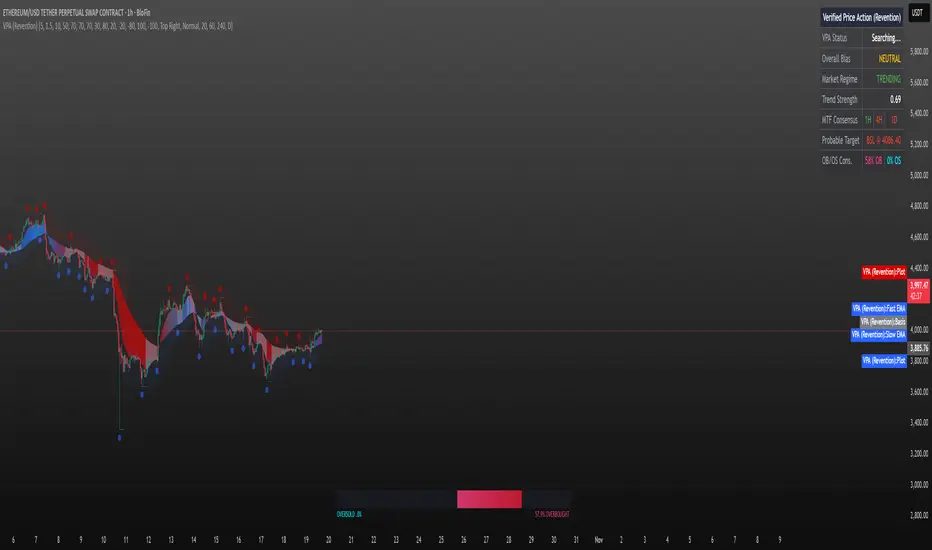
Verified Price Action (Revention)Welcome to Verified Price Action (VPA), an all-in-one market analysis suite designed to transform you from a signal-follower into a market reader. Instead of providing simple "buy" or "sell" arrows that lack context, VPA uses a unique "cockpit" approach to give you a holistic view of the market's state, empowering you to make more intelligent trading decisions.
The core of this indicator is the Volatility Catalyst Engine, a purely reactive strategy that identifies high-probability momentum continuations. It's built on the principle that the market alternates between balance (consolidation) and imbalance (a decisive move). VPA helps you identify this shift and act only after the new direction has been verified.
The VPA Strategy: How It Works
This indicator doesn't predict; it reacts. It waits for a specific sequence of price action to unfold before alerting you to a potential opportunity.
Market Pause (The Anchor Bar): The script first identifies a period of volatility contraction—an Anchor Bar. This is a small, indecisive candle where the market is pausing and building energy.
Volatility Expansion (The Catalyst Bar): Next, it waits for a strong, impulsive Catalyst Bar to break out from the Anchor Bar's range. This explosive move reveals the market's chosen direction.
Momentum Confirmation: Finally, the script looks for immediate follow-through on the next candle to verify the breakout's strength.
Only when this full sequence is complete does the dashboard update to a "CONFIRMED" state.
Key Features
The VPA Cockpit Dashboard: The heart of the indicator. A dynamic status panel tells you exactly where we are in the VPA sequence:
Searching...: Looking for favorable, trending market conditions.
Anchor Detected: A volatility contraction has been found. Pay attention.
Bullish/Bearish Catalyst!: A breakout has occurred. Get ready.
CONFIRMED LONG/SHORT: The breakout has been verified.
Interactive Trend Ribbon: This is more than just a moving average ribbon. It not only displays the current trend direction but also ignites to a bright, vibrant color on a Catalyst Bar, giving you an immediate visual cue that a significant move is underway.
Built-in Market Filters: The VPA engine automatically checks for a Trending Regime and aligns with Higher-Timeframe Consensus, ensuring you are only analyzing setups that are flowing with the broader market current.
Dynamic Liquidity Targets: Automatically plots key buy-side and sell-side liquidity levels based on recent swing points, helping you identify potential targets.
OB/OS Pressure Gauge: A sleek meter at the bottom of the chart provides a consensus view of multiple oscillators, helping you gauge market exhaustion at a glance.
How to Use This Indicator
Check the Environment: First, look at the "Overall Bias" and "Market Regime" on the dashboard. The ideal setup occurs in a "TRENDING" market where your intended direction matches the higher-timeframe bias.
Wait for the "Catalyst!": Monitor the "VPA Status." When it changes to Anchor Detected, it's time to watch closely. The moment it updates to Bullish Catalyst! or Bearish Catalyst! (and the ribbon ignites), you have a potential setup in play.
Make Your Decision on "Confirmed": The final CONFIRMED LONG/SHORT status on the dashboard is your cue that the strategy's conditions have been fully met. Use this information, along with your own analysis, to manage your trade.
This tool was built to help the community trade with more context and confidence. Enjoy!
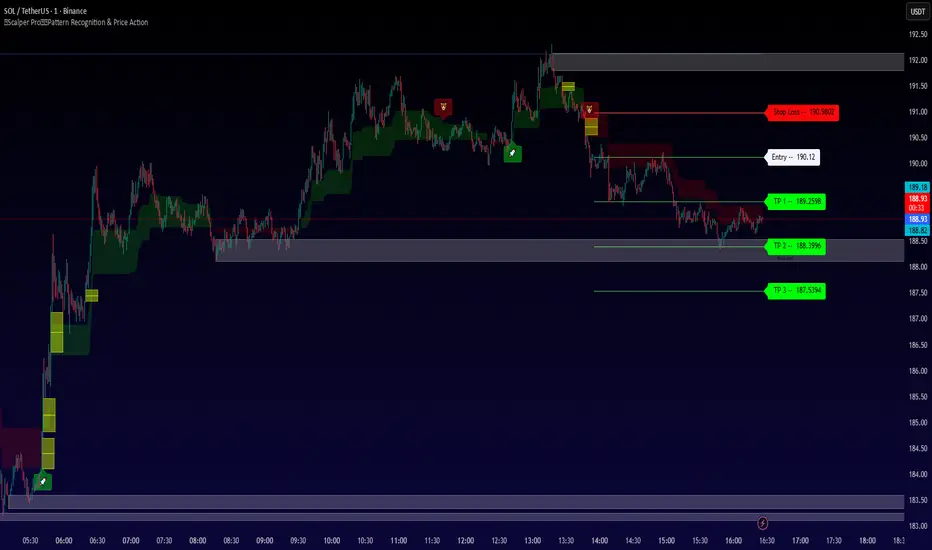
Scalper Pro Pattern Recognition & Price ActionOVERVIEW
Scalper Pro is a comprehensive multi-timeframe trading indicator that combines Smart Money Concepts (SMC) with traditional technical analysis to provide scalpers and day traders with high-probability entry and exit signals. This indicator integrates multiple analytical frameworks into a unified visual system designed specifically for short-term trading strategies.
ORIGINALITY & PURPOSE
What Makes This Script Original
This script is not a simple mashup of existing indicators. Instead, it represents a carefully orchestrated integration of complementary analytical methods that work together to solve a specific problem: identifying high-probability scalping opportunities in volatile markets.
The unique value proposition:
Adaptive Trend Filtering System - Combines a customized SuperTrend algorithm with dual-period range filters (Cirrus Cloud) and Hull Moving Average trend cloud to create a three-layer trend confirmation system
Smart Money Concepts Integration - Incorporates institutional trading concepts (Order Blocks, Fair Value Gaps, Break of Structure) with retail technical indicators for a complete market structure view
Dynamic Risk Management - Automatically calculates stop-loss and take-profit levels based on ATR volatility, providing objective position sizing
ADX-Based Market Regime Detection - Identifies ranging vs. trending markets through ADX analysis with visual bar coloring to prevent whipsaws during consolidation
Why Combine These Specific Components
Each component addresses a specific weakness in scalping:
SuperTrend provides the primary directional bias but can generate false signals in ranging markets
Range Filters smooth out noise and confirm trend direction, reducing SuperTrend false positives
ADX Analysis prevents trading during low-volatility consolidation when most indicators fail
SMC Elements identify institutional activity zones where price is likely to react strongly
ATR-Based Risk Management adapts position sizing to current volatility conditions
The synergy creates a system where signals are only generated when multiple confirmation layers align, significantly reducing false signals common in single-indicator approaches.
HOW IT WORKS
Core Calculation Methodology
1. SuperTrend Signal Generation
The script uses a modified SuperTrend algorithm with the following calculation:
ATR = Average True Range (default: 10 periods)
Factor = 7 (default sensitivity multiplier)
Upper Band = Source + (Factor × ATR)
Lower Band = Source - (Factor × ATR)
Directional Logic:
When price crosses above SuperTrend → Bullish signal
When price crosses below SuperTrend → Bearish signal
SuperTrend value is plotted as dynamic support/resistance
Key Modification: The sensitivity parameter (nsensitivity * 7) allows users to adjust the aggressiveness of trend detection without changing the core ATR calculation.
2. Range Filter System (Cirrus Cloud)
The Range Filter uses a smoothed range calculation to filter out market noise:
Smooth Range Calculation:
WPER = (Period × 2) - 1
AVRNG = EMA(|Price - Price |, Period)
Smooth Range = EMA(AVRNG, WPER) × Multiplier
Two-Layer System:
Layer 1: 22-period with 6x multiplier (broader trend)
Layer 2: 15-period with 5x multiplier (tighter price action)
Visual Output: The space between these two filters is colored:
Green fill = Bullish trend (Layer 1 > Layer 2)
Red fill = Bearish trend (Layer 1 < Layer 2)
This creates a "cloud" that expands during strong trends and contracts during consolidation.
3. ADX Market Regime Detection
Calculation:
+DM = Positive Directional Movement
-DM = Negative Directional Movement
True Range = RMA of True Range (15 periods)
+DI = 100 × RMA(+DM, 15) / True Range
-DI = 100 × RMA(-DM, 15) / True Range
ADX = 100 × RMA(|+DI - -DI| / (+DI + -DI), 15)
Threshold System:
ADX < Threshold (default 15) = Ranging market → Bar color changes to purple
ADX > Threshold = Trending market → Normal bar coloring applies
Purpose: This prevents taking trend-following signals during sideways markets where most indicators produce whipsaws.
4. Smart Money Concepts (SMC) Integration
Order Blocks (OB):
Identified using swing high/low detection with customizable pivot length
Bullish OB: Last down-close candle before bullish Break of Structure (BOS)
Bearish OB: Last up-close candle before bearish BOS
Extended forward until price breaks through them
Fair Value Gaps (FVG):
Detected when a three-candle gap exists:
Bullish FVG: Low > High
Bearish FVG: High < Low
Filtered by price delta percentage to ensure significant gaps
Displayed as boxes that delete when price fills the gap
Break of Structure (BOS) vs. Change of Character (CHoCH):
BOS = Price breaks the previous structural high/low in the current trend direction
CHoCH = Price breaks structure in the opposite direction (potential trend reversal)
Both internal (minor) and swing (major) structures are tracked
Equal Highs/Lows (EQH/EQL):
Detected when consecutive swing highs/lows are within ATR threshold
Often indicates liquidity pools that price may sweep before reversing
5. ATR-Based Risk Management
Calculation:
ATR Band = ATR(14) × Risk Multiplier (default 3%)
Stop Loss = Entry - ATR Band (for longs) or Entry + ATR Band (for shorts)
Take Profit Levels:
TP1 = Entry + (Entry - Stop Loss) × 1
TP2 = Entry + (Entry - Stop Loss) × 2
TP3 = Entry + (Entry - Stop Loss) × 3
Dynamic Labels: Stop loss and take profit levels are automatically calculated and displayed as labels on the chart when new signals trigger.
6. Hull Moving Average Trend Cloud
HMA = WMA(2 × WMA(Close, Period/2) - WMA(Close, Period), sqrt(Period))
Period = 600 bars (long-term trend)
The HMA provides a smoothed long-term trend reference that's more responsive than traditional moving averages while filtering out short-term noise.
HOW TO USE THE INDICATOR
Entry Signals
Primary Buy Signal:
SuperTrend changes to green (price crosses above)
ADX shows market is NOT ranging (bars are NOT purple)
Price is within or near a bullish Order Block OR bullish FVG
Cirrus Cloud shows green fill (Layer 1 > Layer 2)
Primary Sell Signal:
SuperTrend changes to red (price crosses below)
ADX shows market is NOT ranging
Price is within or near a bearish Order Block OR bearish FVG
Cirrus Cloud shows red fill (Layer 1 < Layer 2)
Confirmation Layers
Higher Probability Trades Include:
Bullish/Bearish BOS in the same direction as signal
Equal highs/lows being swept before entry
Price respecting premium/discount zones (above/below equilibrium)
Multiple timeframe alignment (use MTF settings)
Exit Strategy
The indicator provides three take-profit levels:
TP1: Conservative target (1:1 risk-reward)
TP2: Moderate target (2:1 risk-reward)
TP3: Aggressive target (3:1 risk-reward)
Suggested Exit Approach:
Close 1/3 position at TP1
Move stop to breakeven
Close 1/3 position at TP2
Trail remaining position or exit at TP3
Risk Management
Stop Loss:
Use the ATR-based stop loss level displayed on chart
Alternatively, use percentage-based stop (adjustable in settings)
Never risk more than 1-2% of account per trade
Position Sizing:
Position Size = (Account Risk $) / (Entry Price - Stop Loss Price)
CUSTOMIZABLE SETTINGS
Core Parameters
Buy/Sell Signals:
Toggle signals on/off
Adjust SuperTrend sensitivity (0.5 - 2.0)
Risk Management:
Show/hide TP/SL levels
ATR period (default: 14)
Risk percentage (default: 3%)
Number of decimal places for price labels
Trend Features:
Cirrus Cloud display toggle
Range filter periods (x1, x2, x3, x4)
Hull MA length for trend cloud
Smart Money Concepts:
Order Block settings (swing length, display count)
Fair Value Gap parameters (auto-threshold, extend length)
Structure detection (internal vs swing)
EQH/EQL threshold
ADX Settings:
ADX length (default: 15)
Sideways threshold (10-30, default: 15)
Bar color toggle
Display Options:
Previous day/week/month high/low levels
Premium/Discount/Equilibrium zones
Trend candle coloring (colored or monochrome)
BEST PRACTICES & TRADING TIPS
Optimal Use Cases
Scalping on lower timeframes (1m, 5m, 15m)
Rapid entry/exit with clear TP levels
ADX filter prevents choppy market entries
Day trading on medium timeframes (30m, 1H)
Stronger trend confirmation
Better risk-reward ratios
Swing trading entries on higher timeframes (4H, Daily)
Higher-probability structural setups
Larger ATR-based stops accommodate volatility
Market Conditions
Best Performance:
Trending markets with clear directional bias
Post-news volatility with defined structure
Markets respecting support/resistance levels
Avoid Trading When:
ADX indicator shows purple bars (ranging market)
Multiple conflicting signals across timeframes
Major news events without clear price structure
Low volume periods (market open/close)
Common Mistakes to Avoid
Ignoring the ADX filter - Taking signals during ranging markets leads to whipsaws
Not waiting for confirmation - Enter only when multiple layers align
Overtrading - Fewer high-quality setups outperform many mediocre ones
Ignoring risk management - Always use the calculated stop losses
Fighting the trend - Trade WITH the SuperTrend and Cirrus Cloud direction
TECHNICAL SPECIFICATIONS
Indicator Type: Overlay (plots on price chart)
Calculation Resources:
Max labels: 500
Max lines: 500
Max boxes: 500
Max bars back: 500
Pine Script Version: 5
Compatible Timeframes: All timeframes (optimized for 1m to 1D)
Compatible Instruments:
Forex pairs
Crypto assets
Stock indices
Individual stocks
Commodities
THEORETICAL FOUNDATION
Trend-Following Concepts
This indicator is based on the principle that markets trend more often than they range, and that trends tend to persist. The SuperTrend component captures this momentum while the range filters prevent premature entries during pullbacks.
Smart Money Theory
The SMC elements are based on the concept that institutional traders (banks, hedge funds) leave footprints in the form of:
Order Blocks: Areas where large orders were placed
Fair Value Gaps: Inefficient price movements that may be revisited
Liquidity Sweeps: Stop hunts before continuation (EQH/EQL)
Volatility-Based Position Sizing
Using ATR for stop-loss placement ensures that stop distances adapt to current market conditions:
Tight stops in low volatility (avoids excessive risk)
Wider stops in high volatility (avoids premature stop-outs)
PERFORMANCE EXPECTATIONS
Realistic Expectations
Win Rate:
Expected: 45-55% (trend-following systems rarely exceed 60%)
Higher win rates on trending days
Lower win rates during consolidation (even with ADX filter)
Risk-Reward Ratio:
Target: 1.5:1 minimum (TP2)
Achievable: 2:1 to 3:1 on strong trends
Drawdowns:
Normal: 10-15% of account during choppy periods
Maximum: Should not exceed 20% with proper risk management
Optimization Tips
Backtesting Recommendations:
Test on at least 1 year of historical data
Include different market conditions (trending, ranging, volatile)
Adjust SuperTrend sensitivity per instrument
Optimize ADX threshold for your specific market
Record trades to identify personal execution errors
FREQUENTLY ASKED QUESTIONS
Q: Can I use this for automated trading?
A: The indicator provides signals, but you'll need to code a strategy script separately for automation. The signals can trigger alerts that connect to trading bots.
Q: Why do I see conflicting signals?
A: This is normal during transition periods. Wait for all confirmation layers to align before entering.
Q: How often should I expect signals?
A: Depends on timeframe and market conditions. On 5m charts during trending markets: 3-7 quality setups per session.
Q: Can I use only some features?
A: Yes, all components can be toggled on/off. However, the system works best with all confirmations active.
Q: What's the difference between internal and swing structures?
A: Internal = minor price structures (smaller pivots). Swing = major price structures (larger pivots). Both provide different levels of confirmation.
DISCLAIMER
This indicator is a tool for technical analysis and should not be the sole basis for trading decisions. Past performance does not guarantee future results. Always:
Use proper risk management
Test on demo accounts first
Never risk more than you can afford to lose
Combine with fundamental analysis when applicable
Understand that no indicator is 100% accurate
License: Mozilla Public License 2.0
Author: DrFXGOD
VERSION HISTORY & UPDATES
Initial Release - Version 1.0
Integrated SuperTrend, Range Filters, ADX, SMC concepts
ATR-based risk management
Multi-timeframe support
Customizable visual elements
SUPPORT & DOCUMENTATION
For questions, suggestions, or bug reports, please comment on the script page or contact the author through TradingView.
Additional Resources:
Smart Money Concepts: Research ICT (Inner Circle Trader) materials
ATR and Volatility: Refer to Wilder's original ATR documentation
SuperTrend Indicator: Study original SuperTrend strategy papers
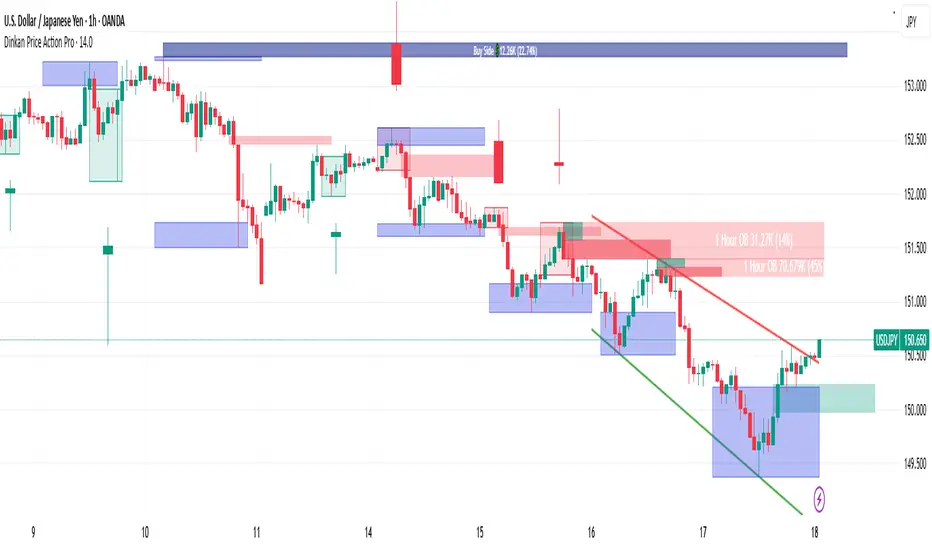
Dinkan Price Action Pro | Pure Price Action Toolkit🔸 Overview
Dinkan Price Action Pro is a pure price-action research toolkit that automatically detects and visualizes Order Blocks (OB), Fair Value Gaps (FVG), merged-candle hidden structures, liquidity zones (including HTF bias liquidity), and trendline & chart-pattern liquidity.
This indicator helps traders align with the Higher Time Frame (HTF) bias — the direction of the dominant institutional wave — and uncover hidden candlestick structures that normal timeframe charts never show.
⚙️ Core Features
✅ Automatic Order Block detection (bullish & bearish)
✅ Fair Value Gaps with real-time fill tracking
✅ Merged-Candle Engine — reveals hidden structures between standard timeframes
✅ Liquidity Zones — equal highs/lows, trendline liquidity & HTF liquidity pools
✅ HTF Bias Engine — detect directional bias across multiple timeframes
✅ Auto Trendlines & Chart Pattern Liquidity
🔍 How It Works (Step by Step)
🕯️ A. Merged Candle Engine (Hidden Structure)
1️⃣ Choose how many candles to merge (e.g., 3–5).
2️⃣ The script groups candles backward from the current bar in continuous sets.
3️⃣ Each merged candle forms using:
• Open = first candle’s open • Close = last candle’s close
• High = highest high • Low = lowest low
4️⃣ These new candles expose “hidden” structures between fixed timeframes — revealing true base-impulse patterns missed by normal charts.
🟩 B. Order Block Detection
Detects consolidation (base) followed by strong impulse.
Marks demand (green) and supply (red) zones automatically.
Strength calculated using impulse range (and volume, if available).
Older, mitigated OBs can be hidden for clarity.
🟦 C. Fair Value Gaps (FVG)
Automatically detects imbalances between consecutive candles.
Unfilled FVGs are highlighted; once filled, zones fade or gray out.
Works dynamically across merged and standard candles.
🟧 D. Liquidity Zones
Finds equal highs/lows, wick clusters, and structural liquidity.
Trendline liquidity and chart-pattern liquidity detected in real time.
Projects HTF liquidity zones from higher charts down to current timeframe.
🔺 E. HTF Bias Engine
Analyzes higher and medium timeframes (HTF/MTF) using CISD-style confirmation.
Bias auto-adjusts or can be manually selected.
🧭 Purpose: Identify the dominant institutional flow and trade in its direction.
⏰ Timeframe Alignment
Recommended structure:
HTF: 4H or 1D
MTF: 1H or 30M
LTF: 15M or 5M
Users may let the script auto-adjust or manually configure each timeframe combination.
📘 Inputs & Settings
🔹 OB sensitivity (Low / Medium / High)
🔹 Volume weighting toggle
🔹 HTF & MTF selection (Auto / Manual)
🔹 Multi-symbol mode
🔹 Visual toggles (OB, FVG, trendlines, merged candles, bias labels)
🔹 Alert toggles (zone touch, bias flip, hidden structure detection)
📊 How to Use — Workflow Example
1️⃣ Load the indicator on your chart.
2️⃣ Check the HTF Bias direction — trade only in that direction.
3️⃣ Identify nearby Order Blocks or FVGs inside HTF liquidity areas.
4️⃣ Watch the Merged Candle View to confirm hidden structures (base + impulse).
5️⃣ Wait for LTF confirmation (e.g., small structure break, wick rejection).
6️⃣ Place stop beyond the opposite OB edge; target next liquidity cluster.
🎯 This workflow aligns your lower-timeframe trades with the dominant higher-timeframe flow.
🧱 Repainting & Stability
Completed OBs and FVGs remain static — they do not repaint.
Real-time zones during candle formation can update until candle closes (standard behavior).
Merged candles are recalculated each bar; once a group closes, it remains fixed historically.
⚠️ Limitations
This is not a buy/sell signal generator.
Volume-weighted features require volume data.
Use responsible risk management and independent confirmation methods.
🔒 Invite-Only / Locked Code
The script is published as invite-only to protect proprietary implementations of:
The merged-candle engine
Liquidity and bias-detection heuristics
Invite-only publishing complies with TradingView rules.
All logic, purpose, and usage are fully described here for transparency.
🧩 Originality & Usefulness
This script is an original integrated system, not a simple mashup.
Each module is interconnected to provide a unified analytical process:
The Merged Candle Engine creates hybrid bars that expose hidden base–impulse patterns.
These merged bars feed into the Order Block and Fair Value Gap logic, refining zone accuracy.
The Liquidity Detector references those zones and merged bars to locate valid structural pools.
Finally, the HTF Bias Engine confirms directional context across multiple pairs and timeframes.
Together, these elements form a dynamic framework that interprets institutional footprints and structure flow — something no single indicator can achieve individually.
The combination produces new analytical value: a precise, adaptive HTF bias alignment and structure-based liquidity map in one visual system.
📜 Disclaimer
This tool is for educational and analytical use only.
It does not constitute financial advice.
Trading involves risk — always perform independent analysis and practice sound risk management.
Past performance does not guarantee future results.